


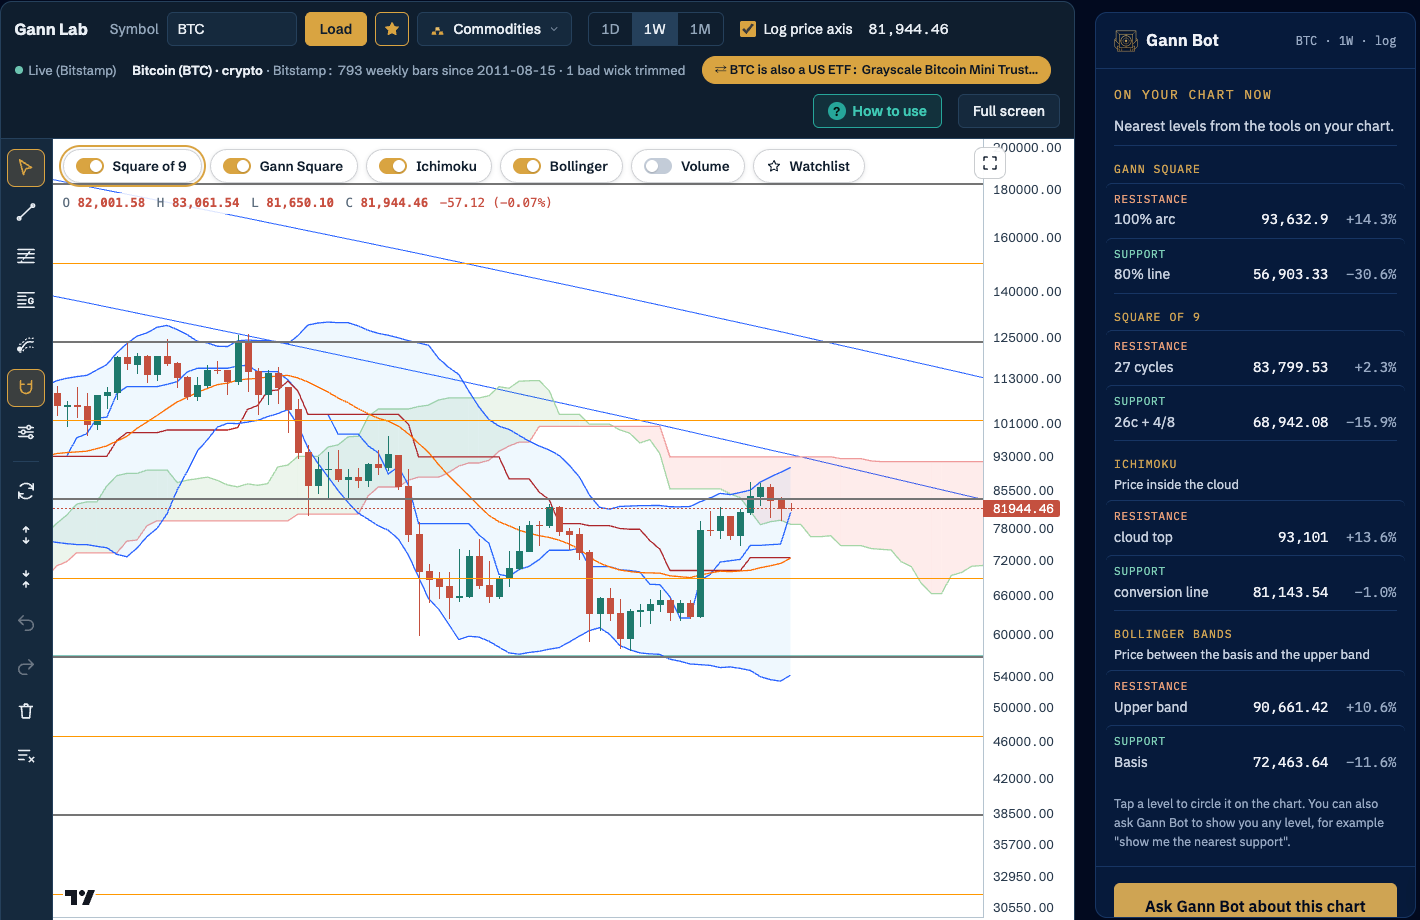
Bitcoin has bounced hard off the low 60,000s, but on the weekly chart it is running straight into a stack of Gann, Ichimoku and Bollinger resistance. Here is where it sits, what would turn the read properly bullish, and where the best risk/reward for buyers lies.
The big picture
After a long slide from the 120,000s, Bitcoin found its footing in the low 60,000s and has just printed one of its strongest weekly candles in months, ripping back to the mid 80,000s. That's a real show of demand. But the rally has carried price back inside the Ichimoku cloud, and the cloud ahead is red. In Ichimoku terms that's undecided ground: the trend hasn't turned up yet, it has just stopped going down.
This week so far, price is stalling just under the 27-cycle Square of 9 level at 83,800, the first Gann line overhead.
Key levels on the chart
| Level | Tool | Price | From price |
|---|---|---|---|
| 100% arc | Gann Square | 93,633 | +14.3% |
| Cloud top | Ichimoku | 93,101 | +13.7% |
| Upper band | Bollinger | 90,654 | +10.7% |
| 27 cycles | Square of 9 | 83,800 | +2.3% |
| Price | ~81,900 | ||
| Conversion line | Ichimoku | 81,144 | −0.9% |
| Basis (20-week average) | Bollinger | 72,461 | −11.5% |
| 26 cycles + 4/8 | Square of 9 | 68,942 | −15.8% |
| 80% line | Gann Square | 56,903 | −30.5% |
Resistance: a wall from 90,600 to 93,600
Look at how the levels overhead stack up. The cloud top at 93,101 and the Gann Square's 100% arc at 93,633 sit just 0.6% apart: that's genuine confluence, two different methods pointing at the same price. Add the upper Bollinger band at 90,654 just below them, and you have a three-tool ceiling between roughly 90,600 and 93,600.
Before that, there's the 27-cycle level at 83,800, right overhead. A weekly close above it would be the first sign the bounce has legs.
Support: thin just below, solid lower down
Directly under price there's only the Ichimoku conversion line at 81,144, a short-term balance line, not a strong level. Below that the chart opens up until the Bollinger basis at 72,461 and the 26c + 4/8 Square of 9 level at 68,942. Those two sit about 5% apart and form a support band between roughly 69,000 and 72,500, right where the last breakout leg started. Much lower, the Gann Square's 80% line at 56,903 lines up with the floor of the recent range, around 57,000 to 60,000: the line in the sand for the bigger picture.
My read
Neutral to cautiously bullish, with the burden of proof on the bulls. The weekly bounce is strong and price is back above the Bollinger basis and the conversion line, which is constructive. But it is inside a red cloud and walking into stacked resistance, so chasing it here offers poor risk/reward.
What would turn it properly bullish: a weekly close above 83,800 opens the way to the 90,600–93,600 wall; a weekly close above 93,600 puts Bitcoin above the cloud and the 100% arc, and that's when the trend turns up in Gann and Ichimoku terms alike.
What would weaken it: a weekly close back below the conversion line at 81,144 says the bounce is fading, and makes the 69,000–72,500 band the likely next stop.
Where are the best bullish buy zones?
Risk/reward is simply how far price could go in your favour compared with how far it could go against you before the idea is wrong. With the first target at the 83,800 level and the bigger target at the 93,100 cloud top, here's how the zones compare:
Buying here, around 81,900 Poor
The nearest support is the conversion line just 1% below, a single, thin line. A weekly close under about 79,500 would break it, and the first resistance is only 2% above. That's roughly 1 to 1 to the first target. Not where the odds are.
The 69,000 – 72,500 support band Best risk/reward
The Bollinger basis and the 26c + 4/8 Square of 9 level, two different tools, at the base of the last breakout leg. Taking the middle of the zone (about 70,700), the idea is wrong on a weekly close below roughly 67,500 (about 4.5% lower). The reward is about +18% to 83,800 and about +32% to the cloud top at 93,100: roughly 4 to 1 and 7 to 1. This is the zone where buyers get paid for waiting.
The 57,000 – 60,000 floor Deep value, only if it comes
The Gann Square's 80% line and the floor of the recent range. Excellent risk/reward if price ever gets there, with a clear invalidation on a weekly close below about 55,800, but it would take a full retrace of this bounce. Worth having on the watchlist, not something to wait for at all costs.
The breakout entry Confirmation
For traders who prefer confirmation over a pullback: a weekly close above 93,600 (above the cloud and the 100% arc) turns the trend up, with that zone becoming support. You pay a higher price, but the trend is on your side.
How to find your own buy zones with Gann levels
The same process works on any chart in Gann Lab:
- Look for overlap, not single lines. A Square of 9 level, a Gann Square angle or arc, a cloud edge or a Bollinger line on its own is a guide. Two or three of them within a percent or two of each other is a zone that matters. The more tools agree, the more weight it carries.
- Prefer support with history. Levels where price has actually traded before (an old breakout, a prior high or low) hold better than lines that price shot straight through in one candle.
- Know where you're wrong before you're in. Put the invalidation just below the zone, on a weekly close (daily on the daily chart), not on a passing wick.
- Measure the reward to the first real resistance. If the first resistance is closer than your invalidation, the setup isn't worth it, however good the chart looks. Aim for at least 2 to 1, ideally 3 to 1 or better.
- Be patient. The best zones are rarely where price is today. Let the chart come to you.
Gann Bot does all of this on your live chart: ask it "where's the best risk/reward?" and it works out the zones, the invalidation and the ratios from the levels on your screen, and tells you which tool to add for more confluence.
This analysis is for education only and is not financial advice. Prices and levels are from the weekly chart on 19 October 2026 and will move as new candles form. Always do your own research; the decision is yours.