


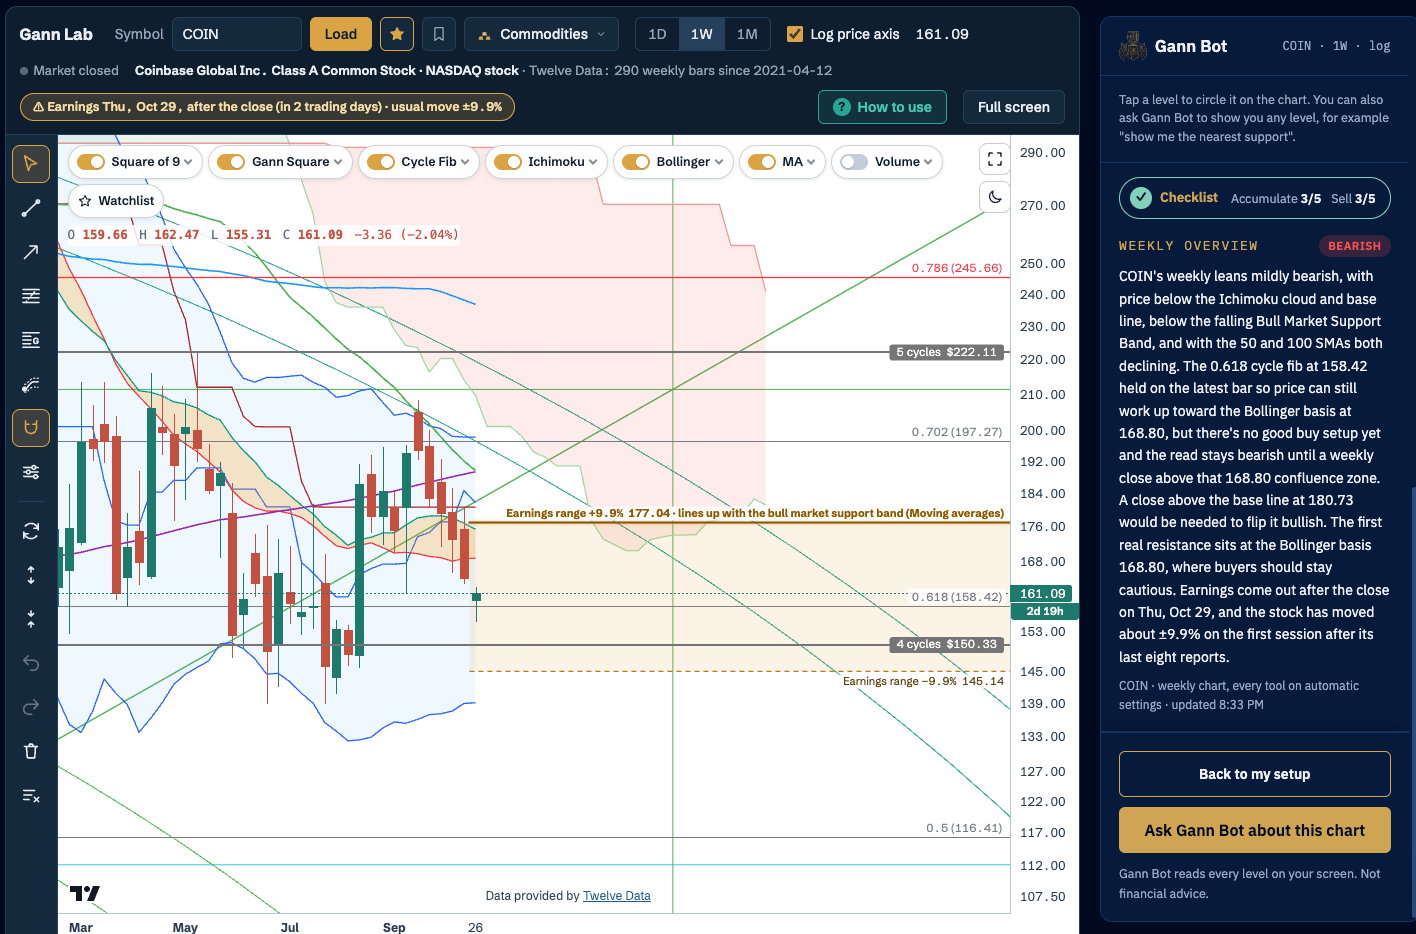
Coinbase reports after the close on Thursday, and its weekly chart is sitting on a single Cycle Fib level with resistance stacked overhead. Here is where it sits, what a normal earnings move would run into on each side, and where the risk/reward actually favours buyers.
The big picture
COIN has spent most of 2026 grinding lower in a wide range, roughly 140 to 210, with each rally since the spring stalling at a lower high. September's push toward 205 failed, and the stock has slid back to the bottom half of the range. It now trades below the Ichimoku cloud and the base line, below the falling bull market support band, with the 50- and 100-week averages both turning down. That's a downtrend that hasn't finished.
The one thing in the bulls' favor: this week price dipped to 155.31 and is holding the 0.618 Cycle Fib at 158.42, the golden ratio of the last cycle. It closed the week so far at 161.09, a small red candle with a long lower wick.
Earnings on Thursday: the usual move
Coinbase reports on Thursday 29 October, after the close, so Friday is the first session that trades on the news. Over its last eight reports the stock has moved about ±9.9% on that first session. From today's price that's a range of 145.14 to 177.04, and the chart has something to say about both edges:
| Usual move | Price | What's there on the chart |
|---|---|---|
| +9.9% | 177.04 | Lines up with the bull market support band, with the base line at 180.73 just above: a stacked ceiling |
| Today | 161.09 | Just above the 0.618 Cycle Fib at 158.42 |
| −9.9% | 145.14 | Just under the 4-cycle Square of 9 level at 150.33, near the summer lows |
In other words, a normal-sized beat would carry COIN straight into its strongest resistance, and a normal-sized miss would land it on support. The chart doesn't promise either, and earnings can gap through any level, but it shows where a reaction is likely to meet a wall. On Gann Lab the range moves with the price until the report; from Friday it stays fixed on Thursday's close, so you can see whether the move actually reaches its usual size.
Key levels on the chart
| Level | Tool | Price | From price |
|---|---|---|---|
| 0.786 | Cycle Fib | 245.66 | +52.5% |
| 5 cycles | Square of 9 | 222.11 | +37.9% |
| 0.702 | Cycle Fib | 197.27 | +22.5% |
| Base line | Ichimoku | 180.73 | +12.2% |
| Earnings range top (and the bull market support band) | Earnings / Moving averages | 177.04 | +9.9% |
| Basis (20-week average) | Bollinger | 168.80 | +4.8% |
| Price | 161.09 | ||
| 0.618 | Cycle Fib | 158.42 | −1.7% |
| 4 cycles | Square of 9 | 150.33 | −6.7% |
| Earnings range bottom | Earnings | 145.14 | −9.9% |
| 0.5 | Cycle Fib | 116.41 | −27.7% |
Resistance: stacked from 169 to 181
The first test is the Bollinger basis at 168.80, under 5% away, the 20-week average that price has been below for weeks. Above it sits the real wall: the bull market support band around 177 and the Ichimoku base line at 180.73, two different tools 2% apart, with the red cloud above them. Every rally since the summer has failed in this area or below it. Clear that and the next levels are the 0.702 Cycle Fib at 197.27 and the 5-cycle Square of 9 level at 222.11.
Support: one line close by, a better zone lower
Directly under price there's just the 0.618 Cycle Fib at 158.42. It held this week, but it's a single line, and a weekly close under it would put the read back on the back foot. Below that, the 4-cycle Square of 9 level at 150.33 and the bottom of the earnings range at 145.14 mark a support zone of roughly 145 to 150, close to the summer lows, with the lower Bollinger band not far beneath. Much lower, the 0.5 Cycle Fib at 116.41 is the line in the sand for the bigger picture.
My read
Mildly bearish, with earnings as the wild card, and the 0.618 holding is the only real bright spot holding so far.
What would turn it bullish: a weekly close above the Bollinger basis at 168.80 is the first step; a weekly close above the base line at 180.73, which also clears the bull market support band, would flip the read bullish. A strong earnings reaction is the most likely way to get there quickly.
What would weaken it further: a weekly close below 158.42 loses the 0.618 and makes the 145–150 zone the likely next stop.
If you already hold: 168.80 and the 177–181 band are where the chart has stopped rallies all year, so that's where holders tend to think about reducing risk, especially with a ±9.9% earnings swing in between.
Where are the best bullish buy zones?
Risk/reward is simply how far price could go in your favour compared with how far it could go against you before the idea is wrong. Earnings change the maths this week: a weekly close is your invalidation, but a report can gap straight past it. With the first target at 168.80 and the bigger target at the base line at 180.73, here's how the zones compare:
Buying here, around 161, before earnings Poor
On paper it looks tempting: the 0.618 at 158.42 is under 2% below and 168.80 is about 5% above. But the usual earnings move is ±9.9%, five times the distance to that support, and the idea would be wrong well before a weekly close could tell you. That's a coin flip, not a setup.
The 145 – 150 support zone Best risk/reward
The 4-cycle Square of 9 level and the bottom of the usual earnings range, near the summer lows. Taking the middle (about 148), the idea is wrong on a weekly close below roughly 139, about 6% lower. The reward is about +14% to 168.80 and about +22% to the base line at 180.73: roughly 2 to 1 and 3.5 to 1. If earnings disappoint, this is where the chart says buyers should be waiting.
The 0.5 Cycle Fib at 116 Deep value, only if it comes
The halfway point of the last cycle, 28% below price. Excellent risk/reward if it ever trades there, with a clear invalidation on a weekly close a few percent below it, but it would take a much deeper break of the range. Worth having on the watchlist, not something to wait for at all costs.
The breakout entry Confirmation
For traders who prefer confirmation, or who'd rather let earnings settle first: a weekly close above 180.73 clears the base line and the bull market support band and turns the read bullish, with 197.27 and then 222.11 as the next levels. You pay a higher price, but the trend would be on your side and the earnings risk behind you.
How to trade around earnings with Gann levels
The same process works on any stock in Gann Lab:
- Check the earnings range against the levels. Gann Lab draws the stock's usual move as a shaded range and lights up an edge that lines up with another tool. If a normal beat runs straight into resistance, as COIN's does, the upside may be limited even on good news.
- Size the stop against the move, not just the chart. If the usual earnings move is bigger than the distance to your invalidation, the level can't protect you. Either wait, or make the position small enough to live with the gap.
- Look for overlap, not single lines. COIN's 0.618 is a single line; the 145 to 150 zone has a Square of 9 level, the earnings edge and old lows together. The more tools agree, the more weight it carries.
- Measure the reward to the first real resistance. Aim for at least 2 to 1, ideally 3 to 1 or better, from where you buy to the first level that has stopped price before.
- Check the checklist. The Checklist bubble in the Gann Bot panel scores any weekly chart on 5 accumulation and 5 sell conditions. A 3 to 3 split, like COIN's, means the read decides it, and here the read is mildly bearish.
Gann Bot does all of this on your live chart: ask it "where's the best risk/reward?" or "what could earnings do here?" and it works it out from the levels on your screen and the stock's own earnings history.
This analysis is for education only and is not financial advice. Prices and levels are from the weekly chart on 27 October 2026, before Coinbase's earnings report on 29 October, and will move as new candles form. Earnings can move a stock far beyond its usual range. Always do your own research; the decision is yours.