

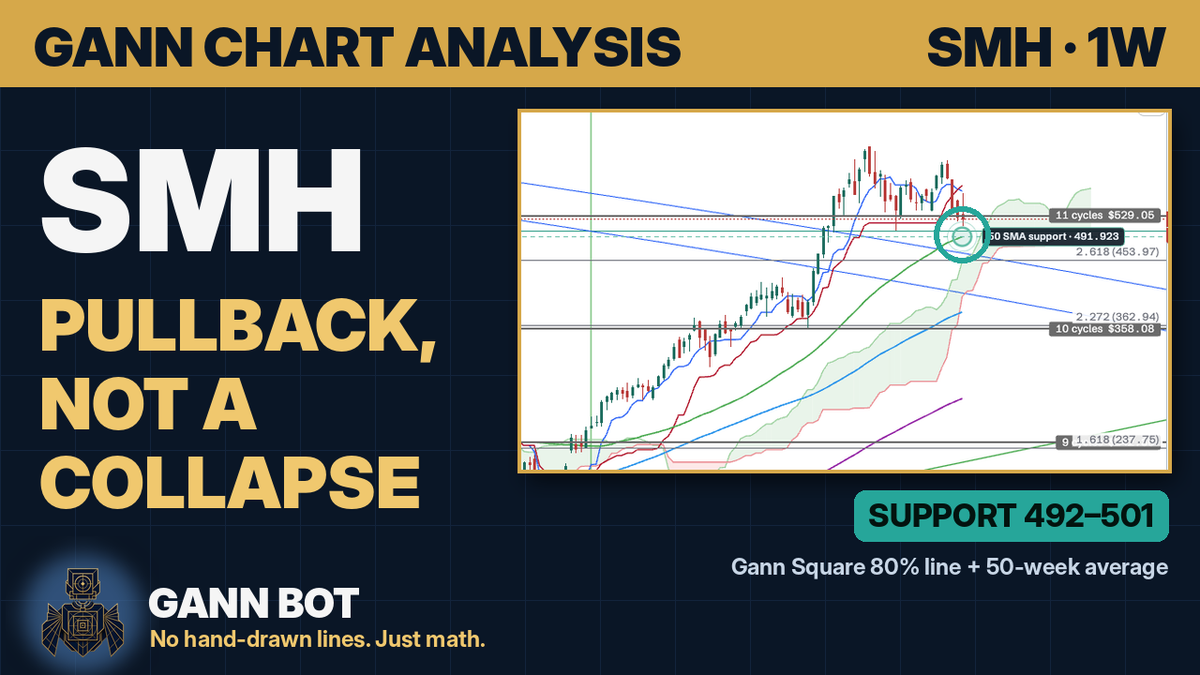
Semiconductors have had a rough few weeks, and the word "collapse" is everywhere. Before reacting to the headlines, it's worth looking at what SMH's weekly chart actually shows: a pullback inside an uptrend, sitting just above a support zone where two different tools agree. Here is where it stands, what would genuinely change the picture, and where the calmer opportunities are.
The big picture
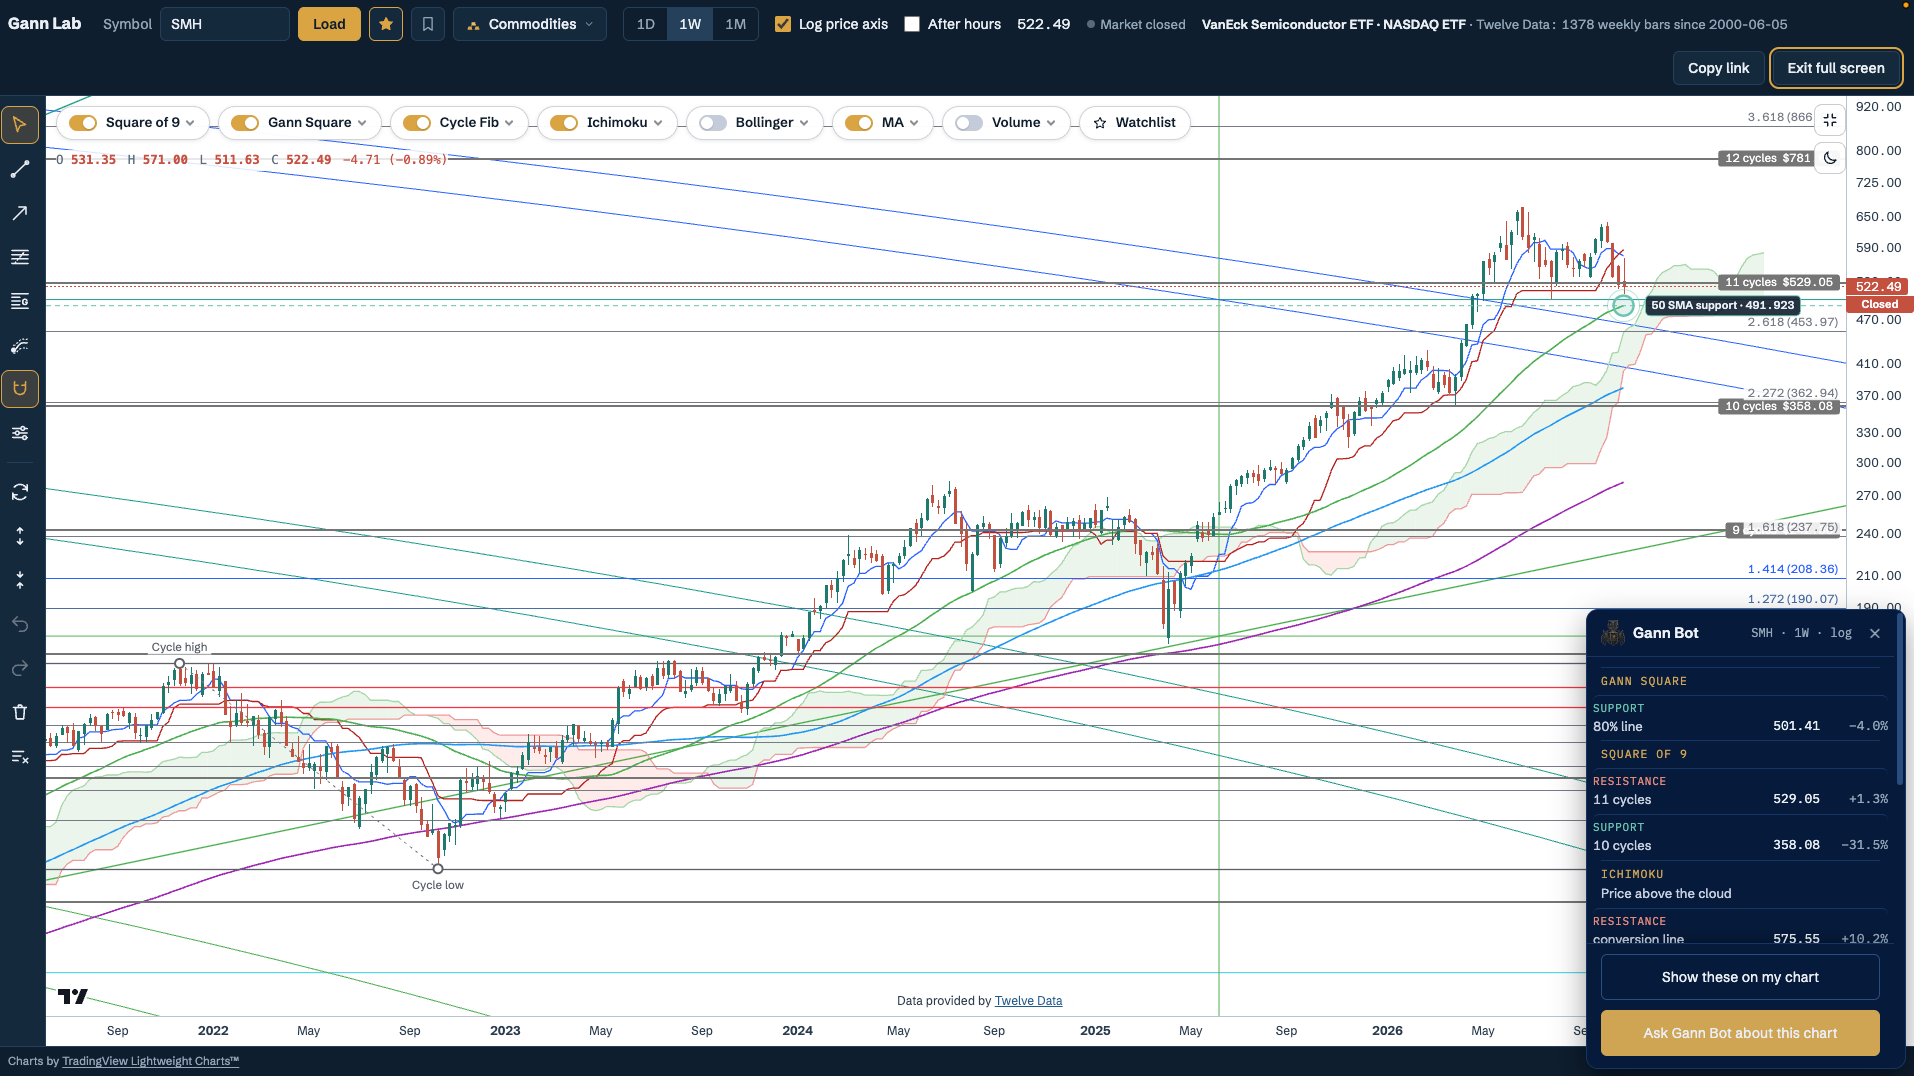
Zoom out first. SMH bottomed under 200 in April 2025 and more than tripled into the mid-600s this year. Since then it has gone sideways, and in October it was turned back near 600 again after reaching a high of 639.47. This week it closed at 522.49, about 18% below that October high, after trading between 511.63 and 571.00.
An 18% pullback after a run like that feels dramatic, but it's not unusual for this ETF. Between its mid-2024 high and the April 2025 low it fell by roughly a third, and that drop turned out to be the launch pad for the move that followed. Semiconductors are a volatile sector; big swings are the price of admission.
More importantly, the structure that defines the uptrend is still in place:
- Price is still above the Ichimoku cloud, and the cloud ahead is green.
- The 50-, 100- and 200-week moving averages are all below price and still rising.
- The automatic Gann Square, anchored at the all-time low, has its 80% line just underneath at 501.41.
Gann Bot's weekly overview, with every tool on automatic, read SMH as mildly bullish at Friday's close. That's not euphoric, but it's a long way from a collapse.
Key levels on the chart
| Level | Tool | Price | From price |
|---|---|---|---|
| 3.618 | Cycle Fib | about 866 | +65.7% |
| 12 cycles | Square of 9 | 781.00 | +49.5% |
| October high | Price | 639.47 | +22.4% |
| Conversion line | Ichimoku | 575.55 | +10.2% |
| 11 cycles | Square of 9 | 529.05 | +1.3% |
| Price (weekly close) | 522.49 | ||
| 80% line | Gann Square | 501.41 | −4.0% |
| 50-week SMA | Moving averages | 491.92 | −5.9% |
| 2.618 | Cycle Fib | 453.97 | −13.1% |
| 2.272 | Cycle Fib | 362.94 | −30.5% |
| 10 cycles | Square of 9 | 358.08 | −31.5% |
| 1.618 | Cycle Fib | 237.75 | −54.5% |
Support: a cushion right under price
This is the part the "collapse" talk skips. Directly beneath price sit two levels from two different tools, less than 2% apart: the Gann Square 80% line at 501.41 and the 50-week moving average at 491.92. Together they make a 492 to 501 support zone, 4 to 6% below Friday's close. The 50-week average has been the rising line underneath this whole rally, and it's still pointing up.
If that zone gives way, the next layer is the 2.618 Cycle Fib at 453.97, about 13% lower. That would be a deeper correction, not a collapse: price would still be far above where this rally started. The levels that would describe a real breakdown, the 2.272 Cycle Fib at 362.94 and the 10-cycle Square of 9 level at 358.08, are more than 30% away, and price would have to lose every layer above them first.
Resistance: what needs to be cleared
Overhead, the first hurdle is the 11-cycle Square of 9 level at 529.05, just 1.3% above the close. A weekly close back above it would be the first sign that the selling is fading. Above that, the Ichimoku conversion line at 575.55 is the line to reclaim for the short-term trend, and then the October high at 639.47, which also sits above the 600 area that has turned price back since the summer. Beyond that, the next Gann levels are the 12-cycle level at 781 and the 3.618 Cycle Fib near 866.
My read
A pullback within an uptrend, not a collapse. The trend tools are all still on the bullish side, and price is resting just above a support zone where two tools agree.
What would turn it more bullish: a weekly close back above 529.05, then above the conversion line at 575.55. That would put SMH back into the middle of its range with the pullback behind it.
What would weaken it: a weekly close below the 50-week average at 491.92. That would be the first real crack in the uptrend, and would make the 2.618 Cycle Fib near 454 the likely next stop. Even then, the levels that would mean a true breakdown are over 30% lower.
If you already hold: the 492 to 501 zone is the line the chart says to watch, on a weekly close, not every intraday dip. Daily swings of 3 to 5% are normal for semiconductors and don't change the weekly picture on their own.
Where are the best bullish buy zones?
Risk/reward is simply how far price could go in your favour compared with how far it could go against you before the idea is wrong. With the first target at the conversion line at 575.55 and the bigger target at the October high at 639.47, here's how the zones compare:
Buying here, around 522 Poor
Price sits right under the 11-cycle resistance at 529.05, and the idea is only wrong below the support zone, around 480, about 8% lower. The reward to 575.55 is about 10%, so roughly 1.25 to 1. Not terrible, but there's a better spot just below.
The 492 – 501 support zone Best risk/reward
The Gann Square 80% line and the 50-week average together. Taking the middle (about 497), the idea is wrong on a weekly close below roughly 480, about 3.4% lower. The reward is about +16% to 575.55 and about +29% to 639.47: roughly 4.5 to 1 and 8.5 to 1. This is where the chart says patient buyers should be waiting.
The 2.618 Cycle Fib near 454 Only if it comes
If the support zone breaks, the 2.618 Cycle Fib at 453.97 is the next real level, 13% below price. With invalidation on a weekly close below about 440, the reward is about +16% to 529.05 and +27% to 575.55, over 5 to 1. Worth having a plan for, not something to wait for at all costs.
The breakout entry Confirmation
For traders who'd rather see the pullback end first: a weekly close above the conversion line at 575.55, with 639.47 and then the 12-cycle level at 781 as the next levels. You pay a higher price, but the short-term trend would be back on your side.
How to tell a pullback from a breakdown with Gann levels
The same process works on any chart in Gann Lab, and it's the best antidote to scary headlines:
- Zoom out to the weekly. Daily candles exaggerate every move. Ask whether price is still above the Ichimoku cloud and the rising 50-, 100- and 200-week averages; if it is, the uptrend hasn't broken.
- Find the nearest support where tools overlap. SMH's 492 to 501 zone has the Gann Square and the 50-week average together. The more tools agree, the more weight a level carries.
- Judge on weekly closes, not intraday wicks. A dip through a level that closes back above it is a test that held, not a breakdown.
- Measure how far the "collapse" levels really are. Here they're over 30% away, with several layers of support in between. Knowing that turns fear into a plan.
- Decide in advance what would change your mind. For SMH: a weekly close below 491.92 weakens it, a weekly close above 529.05 strengthens it. Everything in between is noise.
Gann Bot does all of this on your live chart: ask it "is this a pullback or a breakdown?" or "where's the best risk/reward?" and it works it out from the levels on your screen.
This analysis is for education only and is not financial advice. Prices and levels are from SMH's weekly chart after the close on 30 October 2026, and will move as new candles form. Past swings don't guarantee future ones. Always do your own research; the decision is yours.