


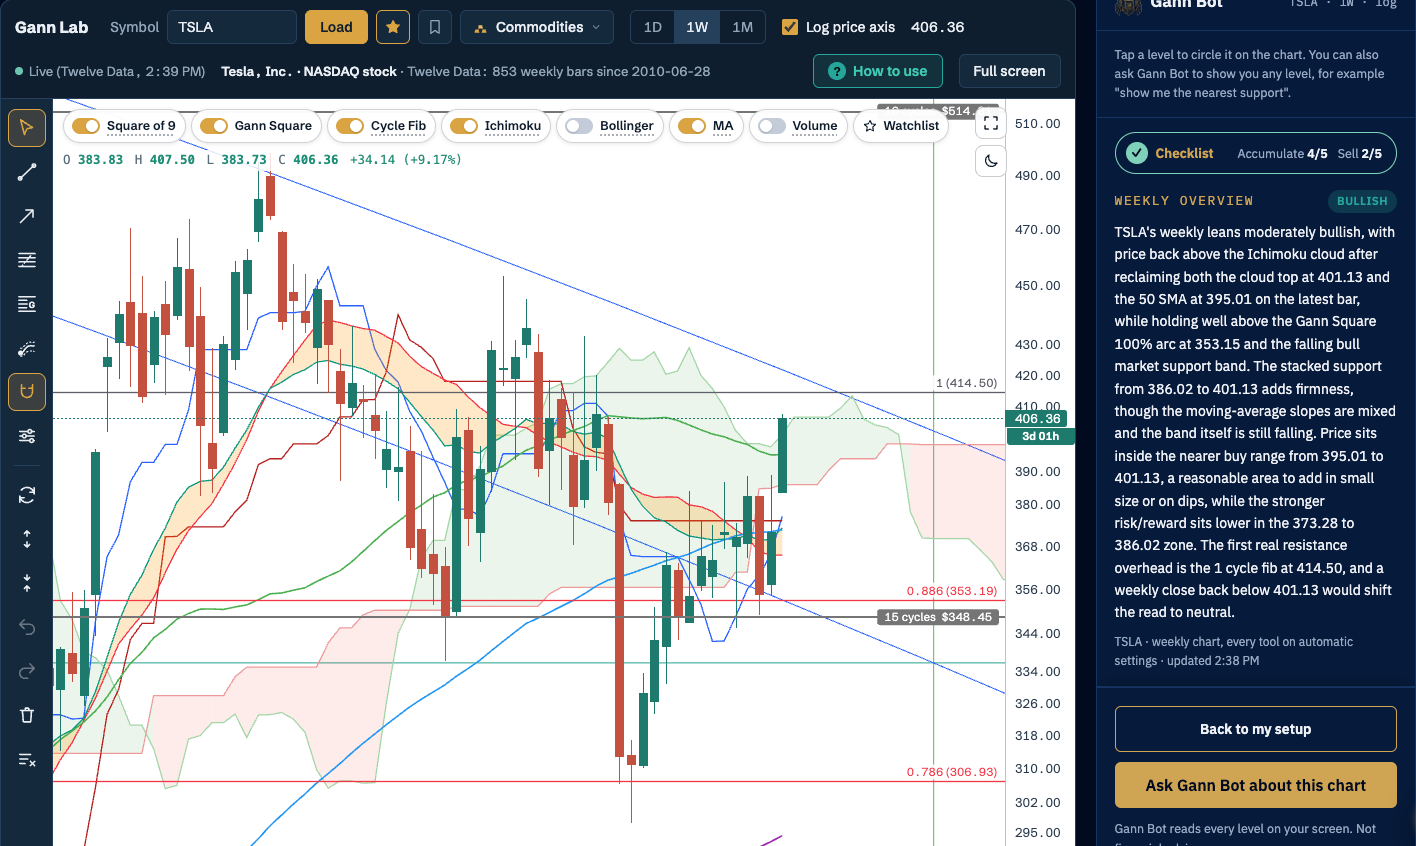
Tesla just put in a 9% weekly candle that carried it back above the Ichimoku cloud and the 50-week average. The read has turned moderately bullish, but the first real resistance is only 2% overhead. Here is where it sits, what would confirm the breakout, and where the best risk/reward for buyers lies.
The big picture
For most of the past year Tesla has been stuck in a wide, choppy range, roughly 340 to 400, after a sharp washout that briefly wicked under the 0.786 Cycle Fib at 306.93 before buyers snapped it back. Since then the lows have been getting higher, and the stock has spent the last few months coiling along the bottom of the cloud.
This week it broke out of that coil. The candle opened at 383.83 and is trading at 406.36, up 9.2%, and in one move it reclaimed the cloud top at 401.13 and the 50-week SMA at 395.01. Price is now above the Ichimoku cloud for the first time in a while, which is exactly what a trend change looks like in its early stages. The week hasn't closed yet, though, and a weekly close is what counts.
Key levels on the chart
| Level | Tool | Price | From price |
|---|---|---|---|
| Next level overhead | Square of 9 | ~514 | +26% |
| 1 (the old cycle high) | Cycle Fib | 414.50 | +2.0% |
| Price | 406.36 | ||
| Cloud top | Ichimoku | 401.13 | −1.3% |
| 50-week SMA | Moving averages | 395.01 | −2.8% |
| Bottom of the stacked support | Several tools | 386.02 | −5.0% |
| Lower support zone | Several tools | 373.28 | −8.1% |
| 0.886 | Cycle Fib | 353.19 | −13.1% |
| 100% arc | Gann Square | 353.15 | −13.1% |
| 15 cycles | Square of 9 | 348.45 | −14.3% |
| 0.786 | Cycle Fib | 306.93 | −24.5% |
Resistance: one line, close by
Overhead, the chart is surprisingly clear, except for one thing. The Cycle Fib's 1 level at 414.50, the top of the previous cycle, sits just 2% above price, and it's where the old range ran out of steam. A falling Gann angle from the old highs runs through the same area, so expect sellers to show up there first.
Above 414.50 there is no Gann level until the next Square of 9 level near 514. In between, the only obstacles are the old swing highs from earlier in the year, around 450 to 470. A weekly close above 414.50 would open that whole stretch.
Support: stacked right under price
This is the strongest part of the chart. Directly below price, the cloud top at 401.13 and the 50-week SMA at 395.01 sit 1.5% apart, and together with the other levels down to 386.02 they form a stacked support zone of about 386 to 401. Old resistance that has just been reclaimed often becomes support, and three tools agree on it here.
Below that, Gann Bot marks a second zone from 373.28 to 386.02, around the bull market support band, where most of the recent coiling took place. And much lower there's a striking confluence: the Gann Square's 100% arc at 353.15, the 0.886 Cycle Fib at 353.19 and the 15-cycle Square of 9 level at 348.45, three methods within 1.4% of each other. That 348 to 353 band is the line in the sand for the bigger picture.
My read
Moderately bullish, but it still has to prove it on the close. Price is back above the cloud and the 50-week average with stacked support underneath, and the Gann Bot checklist shows 4 of 5 accumulation conditions met against 2 of 5 sell. The cautions: the bull market support band is still falling, the cloud ahead thins and turns red, and the first resistance is only 2% away, so this isn't a level to chase.
What would confirm it: a weekly close above 401.13 locks in the cloud breakout; a weekly close above 414.50 clears the old cycle high and opens the way to the 450–470 highs.
What would weaken it: a weekly close back below 401.13 puts price back inside the cloud and turns the read neutral. A close below 386 would make the 373–386 zone the likely next stop.
Where are the best bullish buy zones?
Risk/reward is simply how far price could go in your favour compared with how far it could go against you before the idea is wrong. With the first target at 414.50 and the bigger target at the old highs around 450, here's how the zones compare:
Buying here, around 406 Poor
The support stack is close underneath, but so is resistance. The idea is wrong on a weekly close under about 386, roughly 5% lower, while the first target at 414.50 is only 2% higher: well under 1 to 1. Even all the way to 450, it's barely 2 to 1. The chart looks good, but the odds don't.
The 373 – 386 zone Best risk/reward
The lower support zone around the bull market support band, where Tesla spent weeks coiling before the breakout. Taking the middle (about 380), the idea is wrong on a weekly close below roughly 368, about 3% lower. The reward is about +9% to 414.50 and about +18% to 450: roughly 3 to 1 and 5 to 1. A pullback to retest the breakout would offer exactly this.
The 348 – 353 confluence Deep value, only if it comes
The Gann Square's 100% arc, the 0.886 Cycle Fib and the 15-cycle Square of 9 level, three tools within 1.4%. Excellent risk/reward if price ever gets there, with a clear invalidation on a weekly close below about 340, but it would mean the whole breakout failing. Worth having on the watchlist, not something to wait for at all costs.
The breakout entry Confirmation
For traders who prefer confirmation over a pullback: a weekly close above 414.50 clears the old cycle high, with the 401–414 area becoming support. You pay a higher price, but the trend is on your side and there's open air to the 450–470 highs.
How to find your own buy zones with Gann levels
The same process works on any chart in Gann Lab:
- Look for overlap, not single lines. A Square of 9 level, a Gann Square angle or arc, a cloud edge or a Cycle Fib level on its own is a guide. Two or three of them within a percent or two of each other is a zone that matters, like Tesla's 348 to 353.
- Prefer support with history. Levels where price has actually traded before (an old breakout, a prior high or low) hold better than lines price shot straight through in one candle.
- Know where you're wrong before you're in. Put the invalidation just below the zone, on a weekly close (daily on the daily chart), not on a passing wick.
- Measure the reward to the first real resistance. If the first resistance is closer than your invalidation, as it is for Tesla right now, the setup isn't worth it, however good the chart looks. Aim for at least 2 to 1, ideally 3 to 1 or better.
- Check the checklist. The Checklist bubble in the Gann Bot panel scores any weekly chart on 5 accumulation and 5 sell conditions, and tells you which level has to hold.
Gann Bot does all of this on your live chart: ask it "where's the best risk/reward?" and it works out the zones, the invalidation and the ratios from the levels on your screen, and tells you which tool to add for more confluence.
This analysis is for education only and is not financial advice. Prices and levels are from the weekly chart on 27 October 2026, during a week that hasn't closed yet, and will move as new candles form. Always do your own research; the decision is yours.